Data Summary Template

Data Summary Template


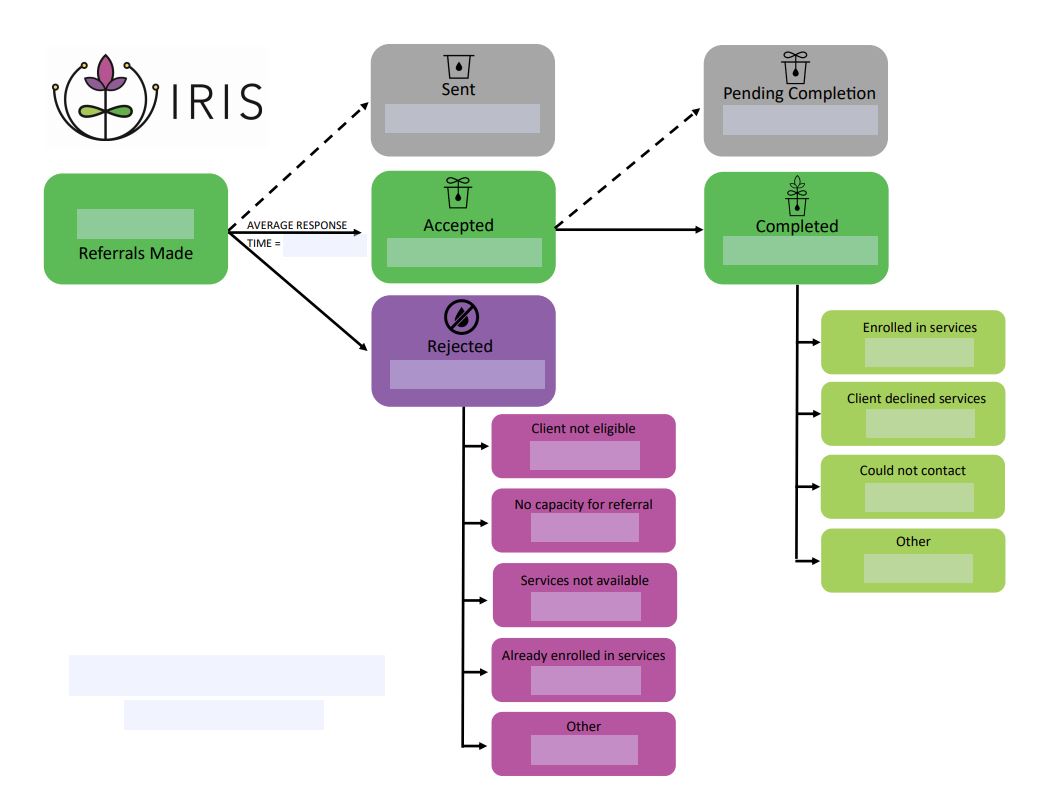
The Data Summary Template is a fillable PDF that can be used to visually summarize your organization's or community's referral data. Use the Data Summary Guide for step-by-step instructions for locating this data.

A flowchart diagram showing the IRIS referral process. It begins with a green ‘Referrals Made’ box, leading to three main outcomes: ‘Sent’ (gray), ‘Accepted’ (green), and ‘Rejected’ (purple). Accepted referrals can progress to ‘Pending Completion’ (gray) and then ‘Completed’ (green), which branches into four outcomes: ‘Enrolled in services,’ ‘Client declined services,’ ‘Could not contact,’ and ‘Other.’ Rejected referrals branch into reasons such as ‘Client not eligible,’ ‘No capacity for referral,’ ‘Services not available,’ ‘Already enrolled in services,’ and ‘Other.’ A dashed arrow between Sent and Pending Completion represents workflow movement, and an arrow labeled ‘Average Response Time’ points from Referrals Made to Accepted. The IRIS logo appears in the top left.